MENU CLOSE

About Kiambu County


Kiambu County is one of the 47 counties in the Republic of Kenya. It is located in the central region and covers a total area of 2,543.5 Km2 with 476.3 Km2under forest cover according to the 2009 Kenya Population and Housing Census. Kiambu County borders.

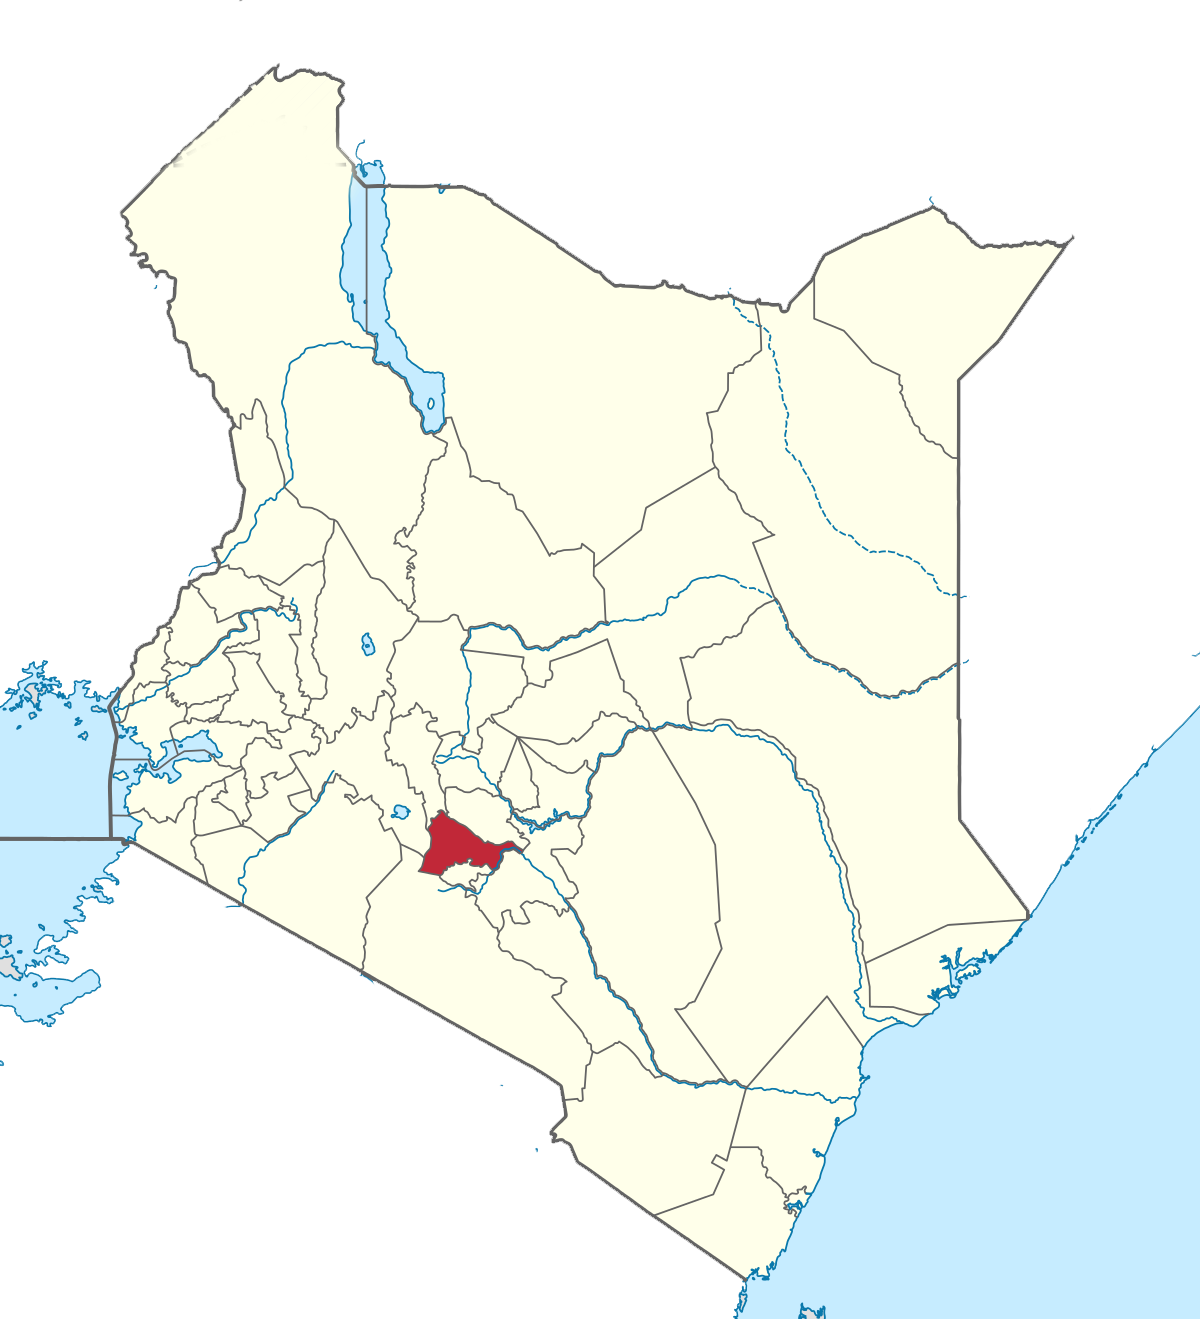
Nairobi and Kajiado Counties to the South, Machakos to the East, Murang‘a to the North and North East, Nyandarua to the North West, and Nakuru to the West as indicated on the map below. The county lies between latitudes 00 25‘ and 10 20‘ South of the Equator and Longitude 360 31‘ and 370 15‘ East.

Physical & Topographic Features

Kiambu County is divided into four broad topographical zones viz, Upper Highland, Lower Highland, Upper Midland and Lower Midland Zone. The Upper Highland Zone is found in Lari Constituency and it is an extension of the Aberdare ranges that lies at an altitude of 1,800-2,550 metres above sea level. It is dominated by highly dissected ranges and it is very wet, steep and important as a water catchment area. The lower highland zone is mostly found in Limuru and some parts of Gatundu North, Gatundu South, Githunguri and Kabete constituencies. The area is characterized by hills, plateaus, and high-elevation plains. The area lies between 1,500-1,800 metres above sea level and is generally a tea and dairy zone though some activities like maize, horticultural crops and sheep farming are also practiced. There are also large plantations of pineapples owned by Del Monte in parts of Thika sub county.

The upper midland zone lies between 1,300-1,500 metres above sea level and it covers mostly parts of Juja and other constituencies with the exception of Lari. The landscape comprises of volcanic middle level uplands. The lower midland zone partly covers Thika Town (Gatuanyaga), Limuru and Kikuyu constituencies. The area lies between 1,200-1,360 metres above sea level. The soils in the midland zone are dissected and are easily eroded. Other physical features include steep slopes and valleys, which are unsuitable for cultivation. Large parts of Lari, Gatundu north and south sub counties are covered by forests.

The county is covered by three broad categories of soils which are: high level upland soils, plateau soils and volcanic footbridges soils. These soils are of varying fertility levels with soils from high-level uplands, which are from volcanic rocks, being very fertile. Their fertility is conducive for livestock keeping and growth of various cash crops and food crops such as tea, coffee, horticultural products, pyrethrum, vegetables, maize, beans, peas and potatoes. These soils are found in the highlands, mostly in Gatundu South, Gatundu North, Githunguri, Kiambu, Kiambaa, Lari, Kikuyu, Kabete and Limuru Constituencies. Low fertility soils are mainly found in the middle zone and the eastern part of the county which form part of the semi-arid areas. The soils are sandy or clay and can support drought resistant crops such as soya beans and sunflower as well as ranching. These soils are mostly found in parts of Juja, Thika Town, Ruiru, Kabete, Limuru, Gatundu North and Gatundu South Constituencies.

Most parts of the county are covered by soils from volcanic footbridges. These are well drained with moderate fertility. They are red to dark brown friable clays, which are suited for cash crops like coffee, tea and pyrethrum. However, parts of Thika Town, Ruiru, Juja and Lari constituencies are covered by shallow soils, which are poorly drained, and these areas are characterized by low rainfall, which severely limits agricultural development, although they are suitable for ranching and growth of drought resistant crops.

Ecological Conditions

Water in the county is from two principal sources- surface and sub-surface. About 90 percent of the county‘s water resource comprises of both surface water resources and round water potential. The county is divided into several sub-catchments areas. The first one is Nairobi River Sub-catchment which occupies the southern part of the county with the major rivers being Nairobi, Gitaru, Gitahuru, Karura, Ruirwaka, and Gatharaini.

The second one is Kamiti and Ruiru Rivers Sub-catchment which is located to the north of the Nairobi river sub-catchment. It has eight permanent rivers which include Riara, Kiu, Kamiti, Makuyu, Ruiru, Bathi, Gatamaiyu and Komothai. The third one is the Aberdare plateau that contributes to the availability of two sub-catchments areas comprising of Thiririka and Ndarugu Rivers. The main streams found in the two areas include Mugutha, Theta, Thiririka, Ruabora, Ndarugu and Komu. They flow from Nairobi, Kamiti, Ruiru, Thiririka, and Ndarugu sub-catchments to form Athi River sub-catchment. The fourth is the Chania River and its tributaries comprising of Thika and Kariminu Rivers which rise from the slopes of Mt. Kinangop in the Aberdares range. Last one is Ewaso Kedong sub catchment which runs in the North-South direction and occupies the western part of the county. It has several streams that normally form swamps.

Climatic Conditions

The county experiences bi-modal type of rainfall. The long rains fall between Mid-March to May followed by a cold season usually with drizzles and frost during June to August and the short rains between Mid-October to November. The annual rainfall varies with altitude, with higher areas receiving as high as 2,000 mm and lower areas of Thika Town constituency receiving as low as 600 mm. The average rainfall received by the county is 1,200 mm.

The mean temperature in the county is 26o C with temperatures ranging from 7oC in the upper highlands areas of Limuru and some parts of Gatundu North, Gatundu South, Githunguri and Kabete constituencies, to 340C in the lower midland zone found partly in Thika Town constituency (Gatuanyaga), Kikuyu, Limuru and Kabete constituencies (Ndeiya and Karai). July and August are the months during which the lowest temperatures are experienced, whereas January to March are the hottest months. The county‘s average relative humidity ranges from 54 percent in the dry months and 300 percent in the wet months of March up to August.

Administrative Units

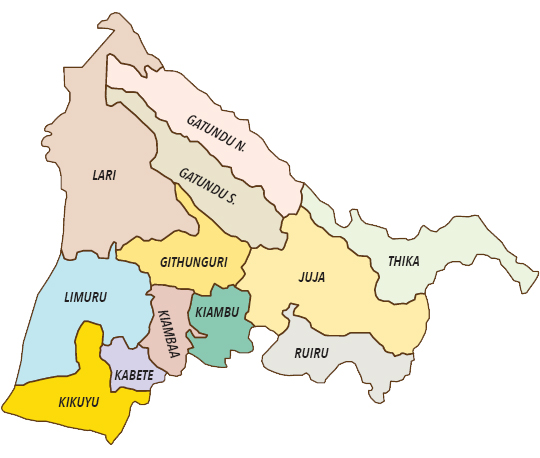
Currently, the County is divided into twelve (12) sub-counties namely Limuru, Kikuyu, Kabete Lari, Gatundu South, Gatundu North, Githunguri, Kiambu, Kiambaa, Ruiru, Juja and Thika Town. These are further divided into 60 wards.

Population Size and Composition

According to the 2009 Kenya Population and Housing Census, Kiambu County population for 2012 was projected to be 1,766,058 with 873,200 males and 892,857 females. Further, the population is expected to reach 2,032,464 people by the end of

2017. This is influenced by the county‘s high population growth rate, which is at 2.81 per cent and the influx of people working in the city who prefer to stay in Kiambu and its environs where there is less congestion and well developed infrastructure.

In terms of gender, the sex ratio of male to female is approximately 1:1.02.

The table below gives population projections for 2012, 2015 and 2017 by gender and different age cohorts using 2009 as the base year.

Population Projections by Age Cohort
AGE GROUP2009 CENSUS2012 PROJECTIONS2015 PROJECTIONS2017 PROJECTIONS
MALEFEMALETOTALMALEFEMALETOTALMALEFEMALETOTALMALEFEMALETOTAL
0-4102,566101,269203,835111,587110,176221,763121,402119,867241,269128,420126,796255,216
05-0993,35892,840186,198101,569101,006202,575110,503109,890220,393116,891116,242233,133
10-1484,26285,230169,49291,67392,726184,40099,736100,882200,619105,502106,714212,216
15-1971,34577,095148,44077,62083,876161,49684,44791,253175,70089,32996,529185,858
20-2482,08897,187179,27589,308105,735195,04397,163115,035212,198102,780121,685224,465
25-2984,61890,428175,04692,06198,382190,442100,158107,035207,193105,948113,222219,170
30-3472,15968,700140,85978,50674,743153,24885,41181,317166,72790,34886,017176,366
35-3958,39153,513111,90463,52758,220121,74769,11463,340132,45573,11067,002140,112
40-4442,26439,00881,27245,98142,43988,42050,02646,17296,19752,91848,841101,758
45-4934,36331,41765,78037,38534,18071,56640,67437,18777,86043,02539,33682,361
50-5422,37920,78143,16024,34722,60946,95626,48924,59751,08628,02026,01954,039
55-5916,78415,89132,67518,26017,28935,54919,86618,80938,67621,01519,89740,911
60-6413,12513,16426,28914,27914,32228,60115,53515,58231,11716,43316,48232,916
65-698,38910,21018,5999,12711,10820,2359,93012,08522,01510,50412,78423,287
70-746,2987,74214,0406,8528,42315,2757,4559,16416,6187,8869,69417,579
75-793,8915,3429,2334,2335,81210,0454,6066,32310,9294,8726,68911,560
80+5,79210,47416,2666,30111,39517,6976,85612,39819,2537,25213,11420,366
NS5373829195844161,0006364521,0886724781,151
TOTAL802,609820,6731,623,282873,203892,8551,766,058950,005971,3871,921,3921,004,9241,027,5422,032,466

From Table 2, it is clear that in ages 0–4, and 5 – 9, the population of males is more than that of females while from age 10 to age 30 years females are more than males. However, from age 30 to 60 years, the population of males is more than that of females. This could be attributed to the fact that the county is a peri-urban area and thus there is an influx of people in this age group who work in Nairobi but reside in Kiambu County. Table 3 gives population projections for special age groups for both males and females using 2009 as the base year.

Population Projections for Selected Age Groups
2009 Census2012 Census2015 census2017 Census
AGEMaleFemaleTotalMaleFemaleTotalMaleFemaleTotalMaleFemaleTotal
Under 122,09122,08444,17523,81223,80447,61625,66625,65851,32426,98226,97353,955
Under 5102,566101,269203,835110,554109,156219,711119,165117,658236,822125,274123,690248,965
Pre-School (3-5)40,98540,28081,26544,17743,41787,59447,61846,79994,41650,05949,19899,257
Primary School (6-13)124,689125,369250,058134,400135,133269,534144,868145,658290,526152,295153,126305,422
Secondary School (14-17)58,37560,926119,30162,92165,671128,59367,82270,786138,60871,29974,415145,715
Youth Population (15-29)223,074249,671472,745240,448269,116509,564259,175290,076549,251272,463304,949577,412
Reproductive age (15-49)-437,297--471,356--508,067--534,116-
Labour Force (15-64)475,149486,112961,261512,156523,9721,036,128552,044564,7821,116,826580,348593,7391,174,087
Aged Population (65+)24,90734,15059,05726,84736,81063,65728,93839,67768,61430,42141,71172,132

Under 1 Year

In 2009, the population of this age group was 44,175 as indicated in Table 3. This represents 2.72 percent of the total population. The population was projected to be 47,617 in 2012, whereby in 2015, the population is projected at 51,324 and 53,955 in 2017. This implies that child survival strategies should be enhanced to reduce infant mortality such as improved nutrition measures to enhance better health for the infants.

Pre – Primary School Age (3 – 5 years)

In 2009, the population of this age group was 81,265 which represent 5.01 percent of the total county population as indicated in Table 3. This population was projected to be 87,594 by 2012. By 2015, it is projected to be 94,416 and 99,257 in 2017. There are 1,063 private ECD centres and 532 public ECD centres. There is need for more ECD centres, especially public, and more qualified teachers to handle this increasing population. The existing public ECD centers are dilapidated and they need refurbishements. Most of the existing latrines are sinking and we need to put up modern toilettes to improve hygiene during this tender age.

Under 5 years

The population of children less than 5 years was 203,835 in 2009. This forms 12.6 percent of the total population. This population was projected to be 219,711 children by 2012. By 2015, the population is projected to reach 236,822 children and 248,965 children in 2017. The projected growth of children in this segment of the population implies that more Early Childhood Development (ECD) centres and programmes should be developed to meet the increasing population.

Primary School Age (6–13 years)

In 2009, the population of this age group was 250,058 as indicated in Table 3. This represents 15.44 percent of the total county population. The population was estimated to be 269,534 in the year 2012, and 290,526 by 2015 and 305,422 at the end of 2017. This increase is likely to create pressure on the available education facilities in the county. The implication is that more primary schools would have to be constructed and more teachers employed to cater for the increasing number of children in this age-group. The existing infrastructure is in bad state and it requires refurbishment.

Youth Age Group (15–29 years)

In 2009, the population of the youth was 472,745 and was expected to reach 509,564 in 2012, 549,251 in 2015 and 577,412 by the end of year 2017. The youth forms 29.1 percent of the total county population. To cater for this population, more investment in vocational trainings, youth empowerment centres and tertiary institutions is crucial so as to equip the youth with necessary skills and knowledge for gainful employment and job creation. In addition, institutions of higher learning such as technical colleges will need to be equipped and upgraded to offer competitive skills particularly to those who cannot proceed to the university. There is also need to create facilitative mechanisms for the youth to access loans such as those available through the Youth Enterprise Fund to assist them engage in income generating activities rather than joining illegal groupings or engaging in drug and substance abuse

Secondary School Age (14–17 years)

The population of the secondary school going age as at 2009 was at 119,301. This age group forms 7.4 percent of the total population. It was projected to reach 128,593 in the year 2012, 138,608 in 2015 and 145,715 people in 2017. This will require additional physical facilities for secondary schools and employment of more teachers. In addition, the county would be required to improve on the facilities available in vocational training centres and the youth polytechnics.

Labour Force (15–64 years)

In 2009, the labour force in the county was 961,261, which comprised of 475,149 males and 486,112 females which translates to 59.2 percent of the population. It was projected to rise to 1,036,128 in 2012, 1,116,826 in 2015 and 1,174,087 at the end of 2017. With the steady growth of the labour force, there will be a major challenge of creating employment opportunities especially in the formal sector. Employment in the formal sector has been on the decrease with the only major employer being the informal Jua. Kali sector.

Female Reproductive Age Group (15–49 years)

The female in the  reproductive age (15-49 years) form 26.9 percent of the total population. This  population was 437,297 in 2009 and was expected to reach 471,356 in the year  2012, 508,067 in 2015 and 534,116 in 2017. This increase indicates a need for  intensive family planning campaigns in the county to address the high  population growth rates. There is need to have health facilities which are well  equipped and with adequate staff who are knowledgeable about family planning  methods and techniques. This will ensure that they are able to handle equipment  related to family planning so as to increase and improve maternal and child  health care services. Nutrition standards need to be improved in areas of the  county considered to be poor through proper utilization of the resources  available. There will be need to make deliberate efforts to invest resources in  food-deficient areas in order to ensure food security for the residents in  these areas.

Aged Population (65 and above)

In 2009 this population was 59,057 in the entire county. This represents 3.64 percent of the total population. In the year 2012, this population was projected at 63,657, and 68,614 in 2015 and 72,132 in 2017. This increase calls upon enhancement of the social security programmes such as Cash Transfer Programme for the elderly to ensure their welfare is well taken care of.

The 2009 Population and Housing Census indicate that the county had an urban population of 936,411 in 2009 and in 2012 was projected to be 1,018,773. Urban population is expected to reach 1,108,380 in 2015 and 1,172,453 by the end of 2017. The county urban population distribution per urban centres is as illustrated in table 4 below which shows that Ruiru and Kikuyu towns have the highest number of people living in urban areas, followed by Thika and Karuri towns respectively. This high population in urban centres can be attributed to the proximity of the county to Nairobi as most of the people work in Nairobi and reside in the county. In addition, industrial development in some districts like Thika West and Ruiru attract more labour force. In these areas, urban planning should be effectively undertaken to avoid strain on the physical amenities from growth of informal settlements. In addition, community policing should be enhanced to reduce insecurity. Also, more infrastructural facilities like transport network, housing, schools and health centres should be built. The population distribution by urban centres is shown below.

Population Distribution and Density by Constituency
2009 CENSUS2012 CENSUS2015 PROJECTIONS2017 PROJECTIONS
POPULATIONDENSITY (KM2)POPULATIONDENSITY (KM2)POPULATIONDENSITY(KM2)POPULATIONDENSITY(KM2)
Gatundu114,180593124,223645135,149702142,962742
South
Gatundu100,611352109,460383119,088417125,972441
North
Juja118,793365129,241397140,609432148,737457
Thika165,342760179,885827195,706900207,020952
Town
Ruiru201,9861,003219,7521,091239,0801,187252,9011,256
Githunguri147,763852160,760927174,8991,008185,0101,067
Kiambaa145,0531,979157,8112,153171,6912,342181,6172,478
Kiambu108,6981,026118,2591,116128,6601,214136,0981,285
Kabete140,4272,329152,7782,534166,2162,757175,8252,916
Kikuyu125,402713136,432776148,432844157,012893
Limuru131,132466142,666507155,214552164,187583
Lari123,895282134,792307146,648334155,125353
Total1,623,2826381,766,0586941,921,3927552,032,466799